rubik-figure20-13.jpg
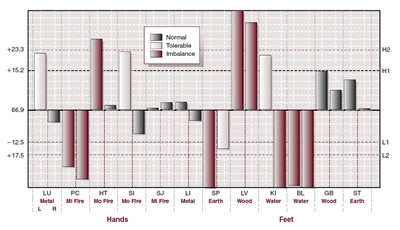
Image provided by Dr. Beverly Rubik
Figure 20-13. Example of the bar chart showing the 24 acupuncture point conductivity values generated by EMAS software.
Image provided by Dr. Beverly Rubik
Figure 20-13. Example of the bar chart showing the 24 acupuncture point conductivity values generated by EMAS software.
FAIM depends on public donations to continue its work. You can help!
The Foundation for Alternative and Integrative Medicine (FAIM) is a private 501(c)(3) nonprofit foundation.
Thank you for your tax-deductible support!